
We have seen how to install the ELK stack using Docker Compose.
Now we add Filebeat, showing how to run it with Docker and use it with the ELK stack.
The final goal of this series of posts is in fact to show a complete example of how to read the logs of a microservice with Filebeat, and then to collect and visualize them through the ELK stack (Elasticsearch, Logstash, Kibana).
Let’s assume we already have the ELK stack ready, after installing it as described in the previous post.
The first thing to run Filebeat on Docker is to pull it’s latest image.
docker pull docker.elastic.co/beats/filebeat:7.10.2
Download an example configuration file for Filebeat.
curl -L -O https://raw.githubusercontent.com/elastic/beats/7.10/deploy/docker/filebeat.docker.yml
We edit it to set our settings.
In addition to accessing Kibana, we indicate as input a folder of the container on which Filebeat will run and as output Logstash.
filebeat.inputs:
- type: log
  enabled: true
  paths:
    - /logs/*.log

setup.kibana:
  host: "localhost:5601"
  username: "elastic"
  password: "changeme"

output.logstash:
  hosts: ["localhost:5044"]
If we go to check the Logstash pipeline configuration, in the “docker-elk /logstash/pipeline/logstash.conf” file, we see that it is already set up to listen from Filebeat, port 5044.
input {
        beats {
                port => 5044
        }

        tcp {
                port => 5000
        }
}

## Add your filters / logstash plugins configuration here

output {
        elasticsearch {
                hosts => "elasticsearch:9200"
                user => "elastic"
                password => "changeme"
                ecs_compatibility => disabled
        }
}
Create a directory that will cointains our log files to be read.
We suppose that this directory is inside our home directory, together with the Filebeat configuration file.
mkdir test-filebeat
Create inside the directory a test.log file with inside some dummy data.
INFO - File loaded
ERROR - File finished
INFO - Please provide a new file
INFO - File loaded
Now we can run the Filebeat container using our configuration.
docker run -d --name=filebeat --user=root --network="host" --volume="$HOME/test-filebeat:/logs" --volume="$HOME/filebeat.docker.yml:/usr/share/filebeat/filebeat.yml:ro" docker.elastic.co/beats/filebeat:7.10.2 filebeat -e --strict.perms=false
You can see the Filebeat container running together the ELK stack.

Check the Filebeat container logs.
docker logs -f filebeat
You will see that the test.log file has been read.

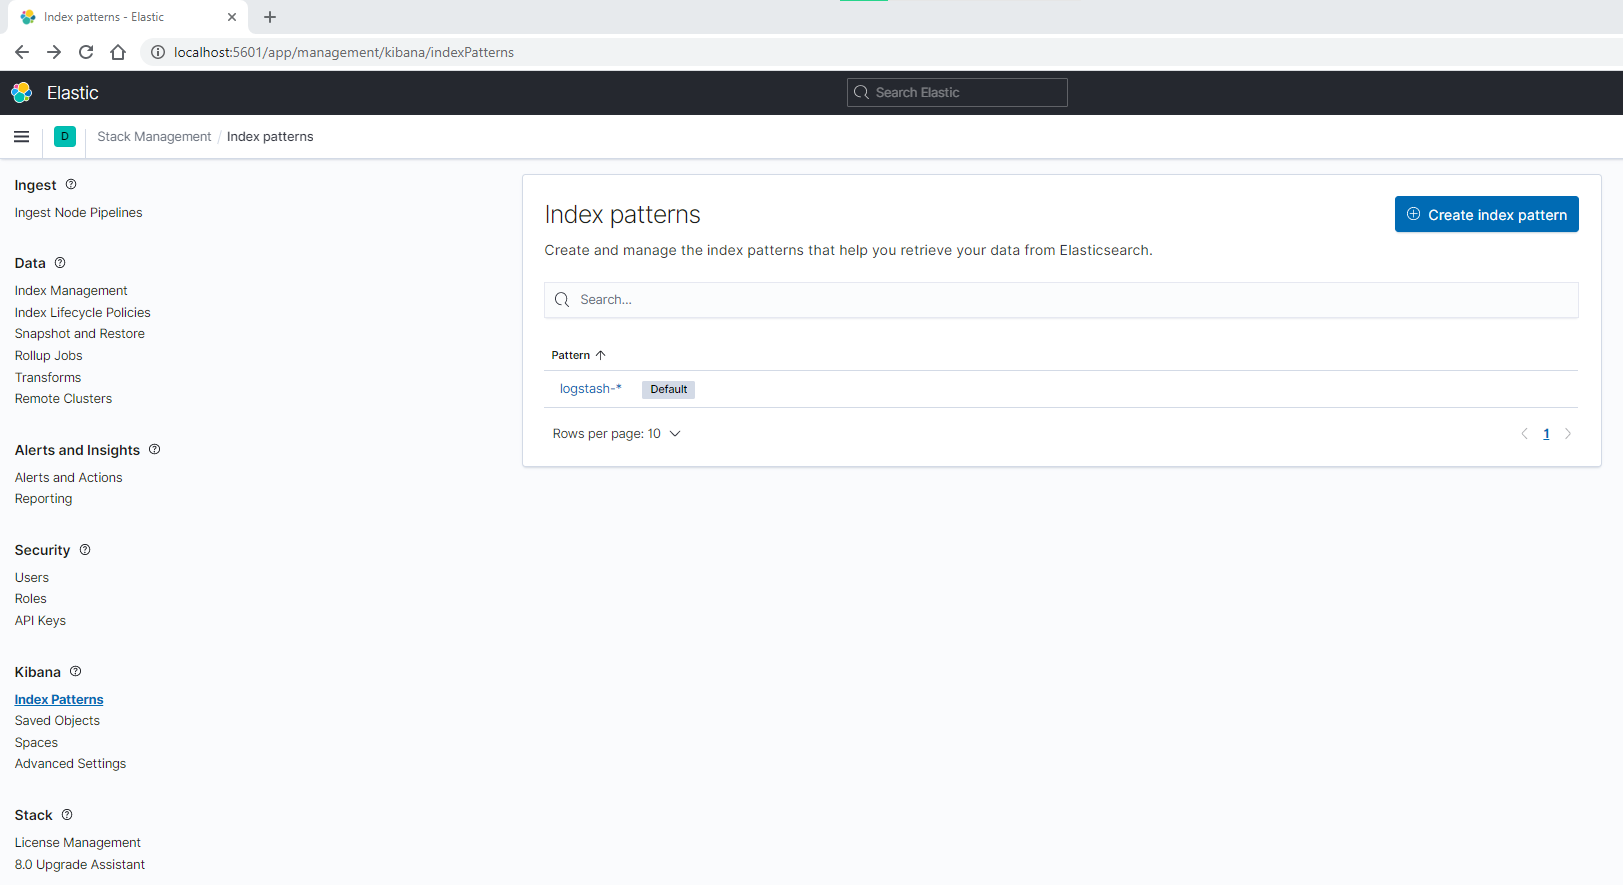
Open Kibana, go to manage section, add a Kibana index pattern for Logstash, “logstash-*” using timestamp.
Go to the Kibana discover section and select last 24 hours.
You will able to see the data read from our test.log file.

In a future post we will create and add a Node.js microservice to our work, which will produce some more real log events.